
Pie and donut chart module
Show how a whole splits into parts, such as a budget, a market or a margin.
Choose Charts and Graphs in the module bar and pick the chart type from its menu. Click the chart to open its editor, where you change the labels, values and colours.
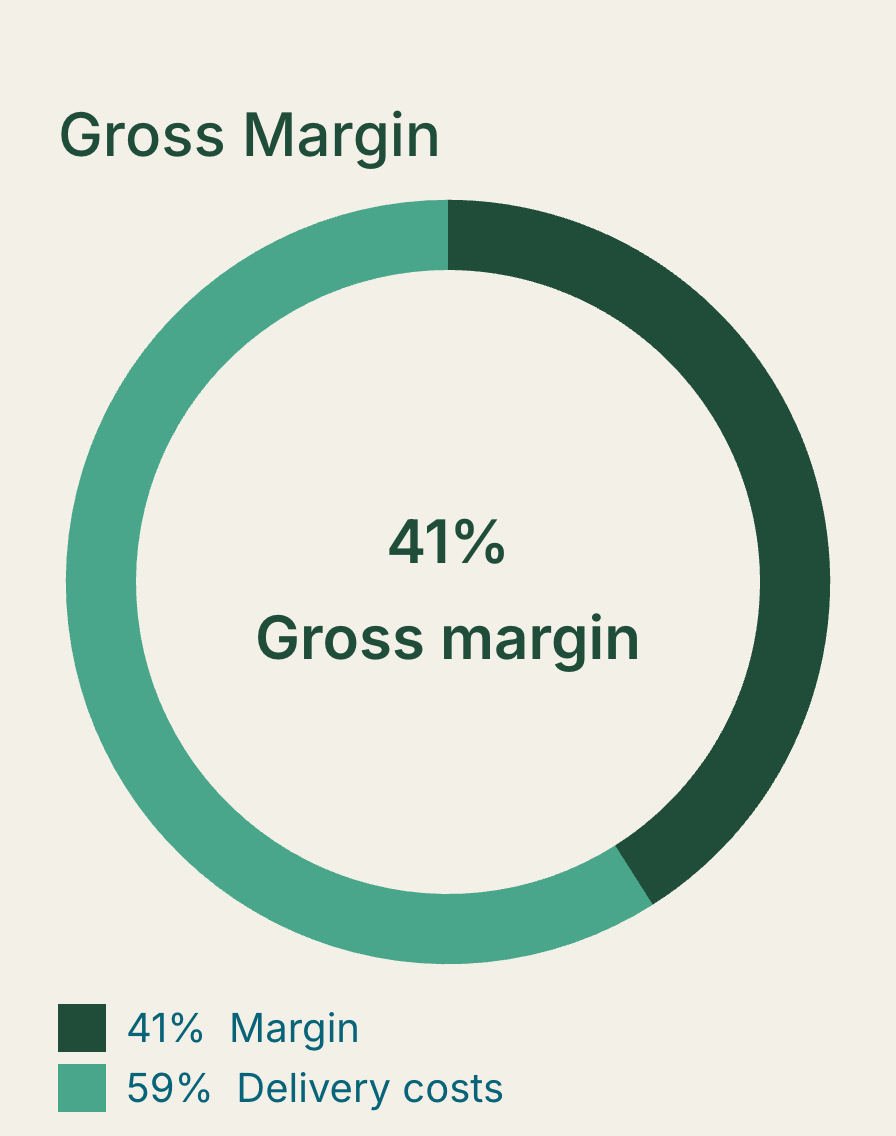
Charts use your deliverable’s main colour. See Change the deliverable main color.
Related: Working with modules · The editor toolbar
Was this article helpful?