Bar / Line Graph Module
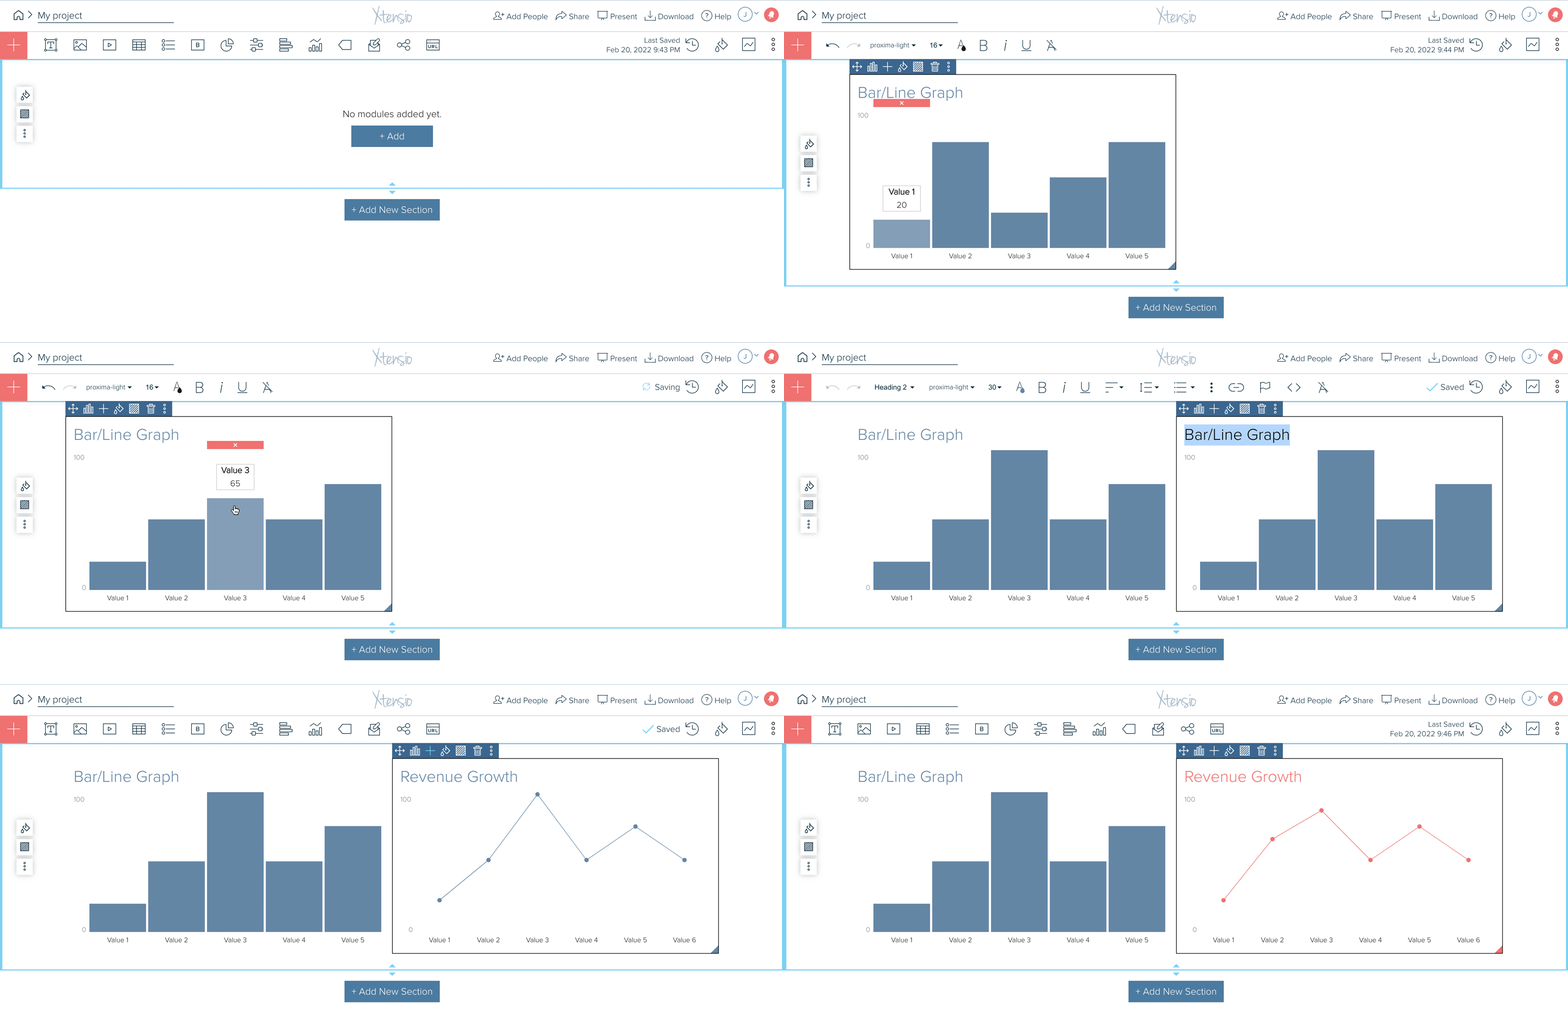
You can add different charts and graphs into your folios to visualize data however you need. The bar/line graph module allows you to visualize data using vertical bars or a line graph.
Add a new bar/line graph module by clicking on the bar/line graph icon in the default toolbar state, dragging the bar/line graph module icon from the toolbar into the content of your folio, or by clicking the red + icon and “add module” at the top left of the edit screen.
Once the line graph is added to your folio:
- Click on any bar and drag up or down to change values.
- Select the value text on the bottom X-axis and change the segment name.
- Or click on the bar and update the segment name and value in the box that appears on top of that segment.
- To increase or decrease the height of the Y-axis, click on the 100 at the top of the Y-axis and update it to any number.
- Add new segments by clicking the + icon on the menu at the top left of the module.
- Switch between a bar chart and line graph by selecting the chart icon on the module menu.
Here are other things you can do with modules using the menu at the top left of each content block:
