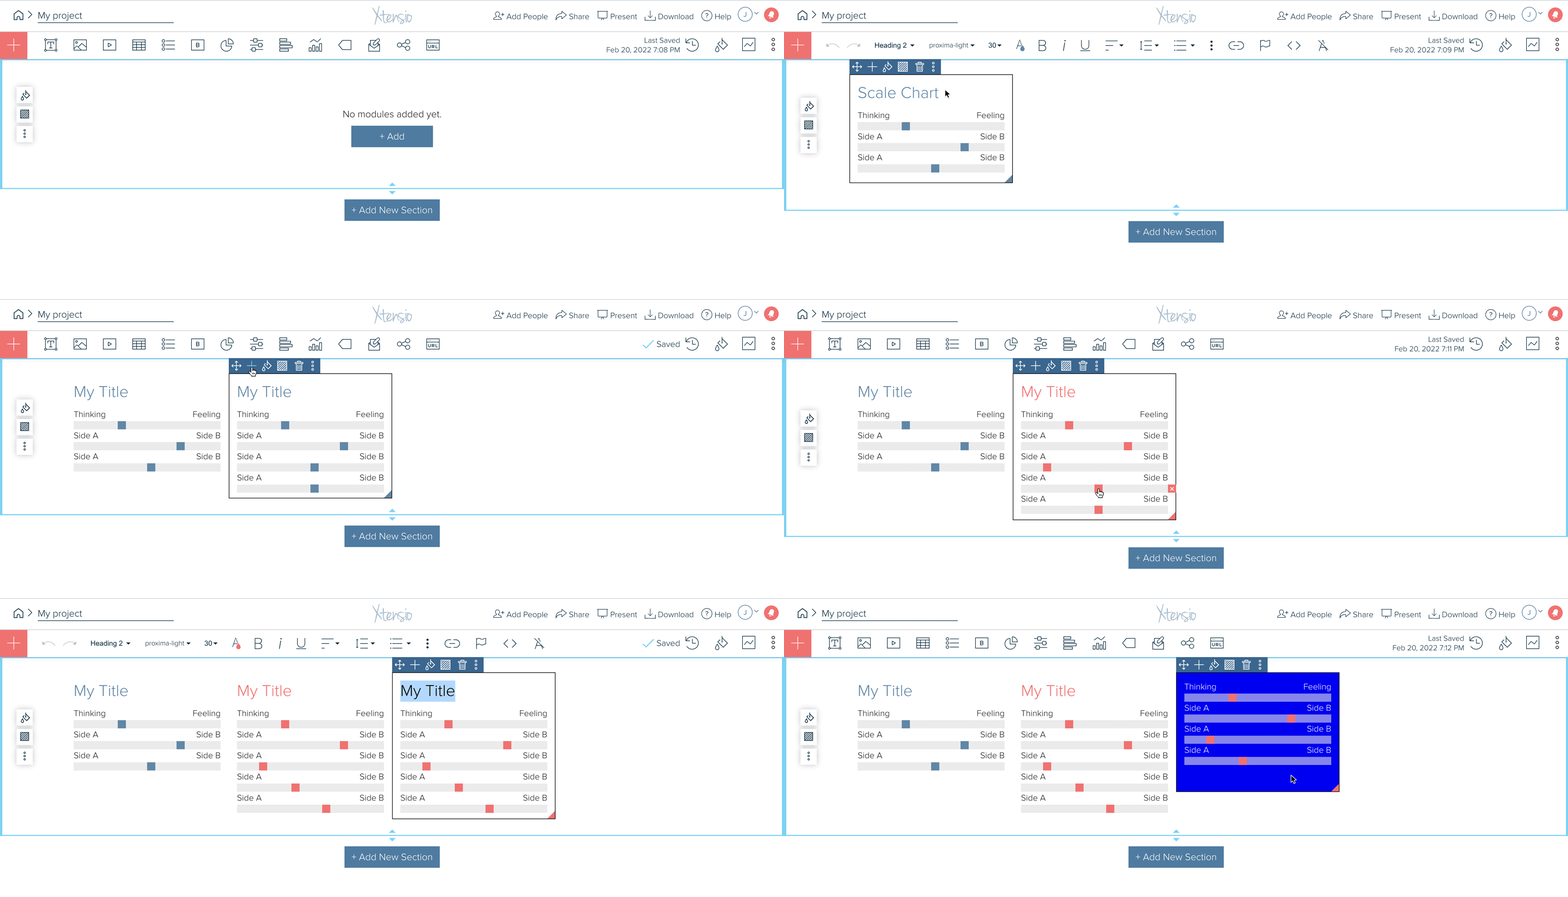
Scale Chart Module
The scale chart module allows you to visualize data points on an A-B scale. Add a new scale chart module by clicking on the sccale chart icon in the default toolbar state, dragging the scale chart module icon from the toolbar into the content of your folio, or by clicking the red + icon and “add module” at the top left of the edit screen.
Once the module is added to your folio:
- Add labels to the left and right side of each segment.
- Move the slider left or right.
- Add new segments by clicking the + icon on the menu at the top left of the module.
Here are other things you can do with modules using the menu at the top left of each content block:
