
View engagement analytics
See what happens after you send a deliverable: how many people opened it, for how long, and how far they got.
Open Engagement Analytics from the right-hand tools in the editor, or from a deliverable’s ⋮ menu on your dashboard.
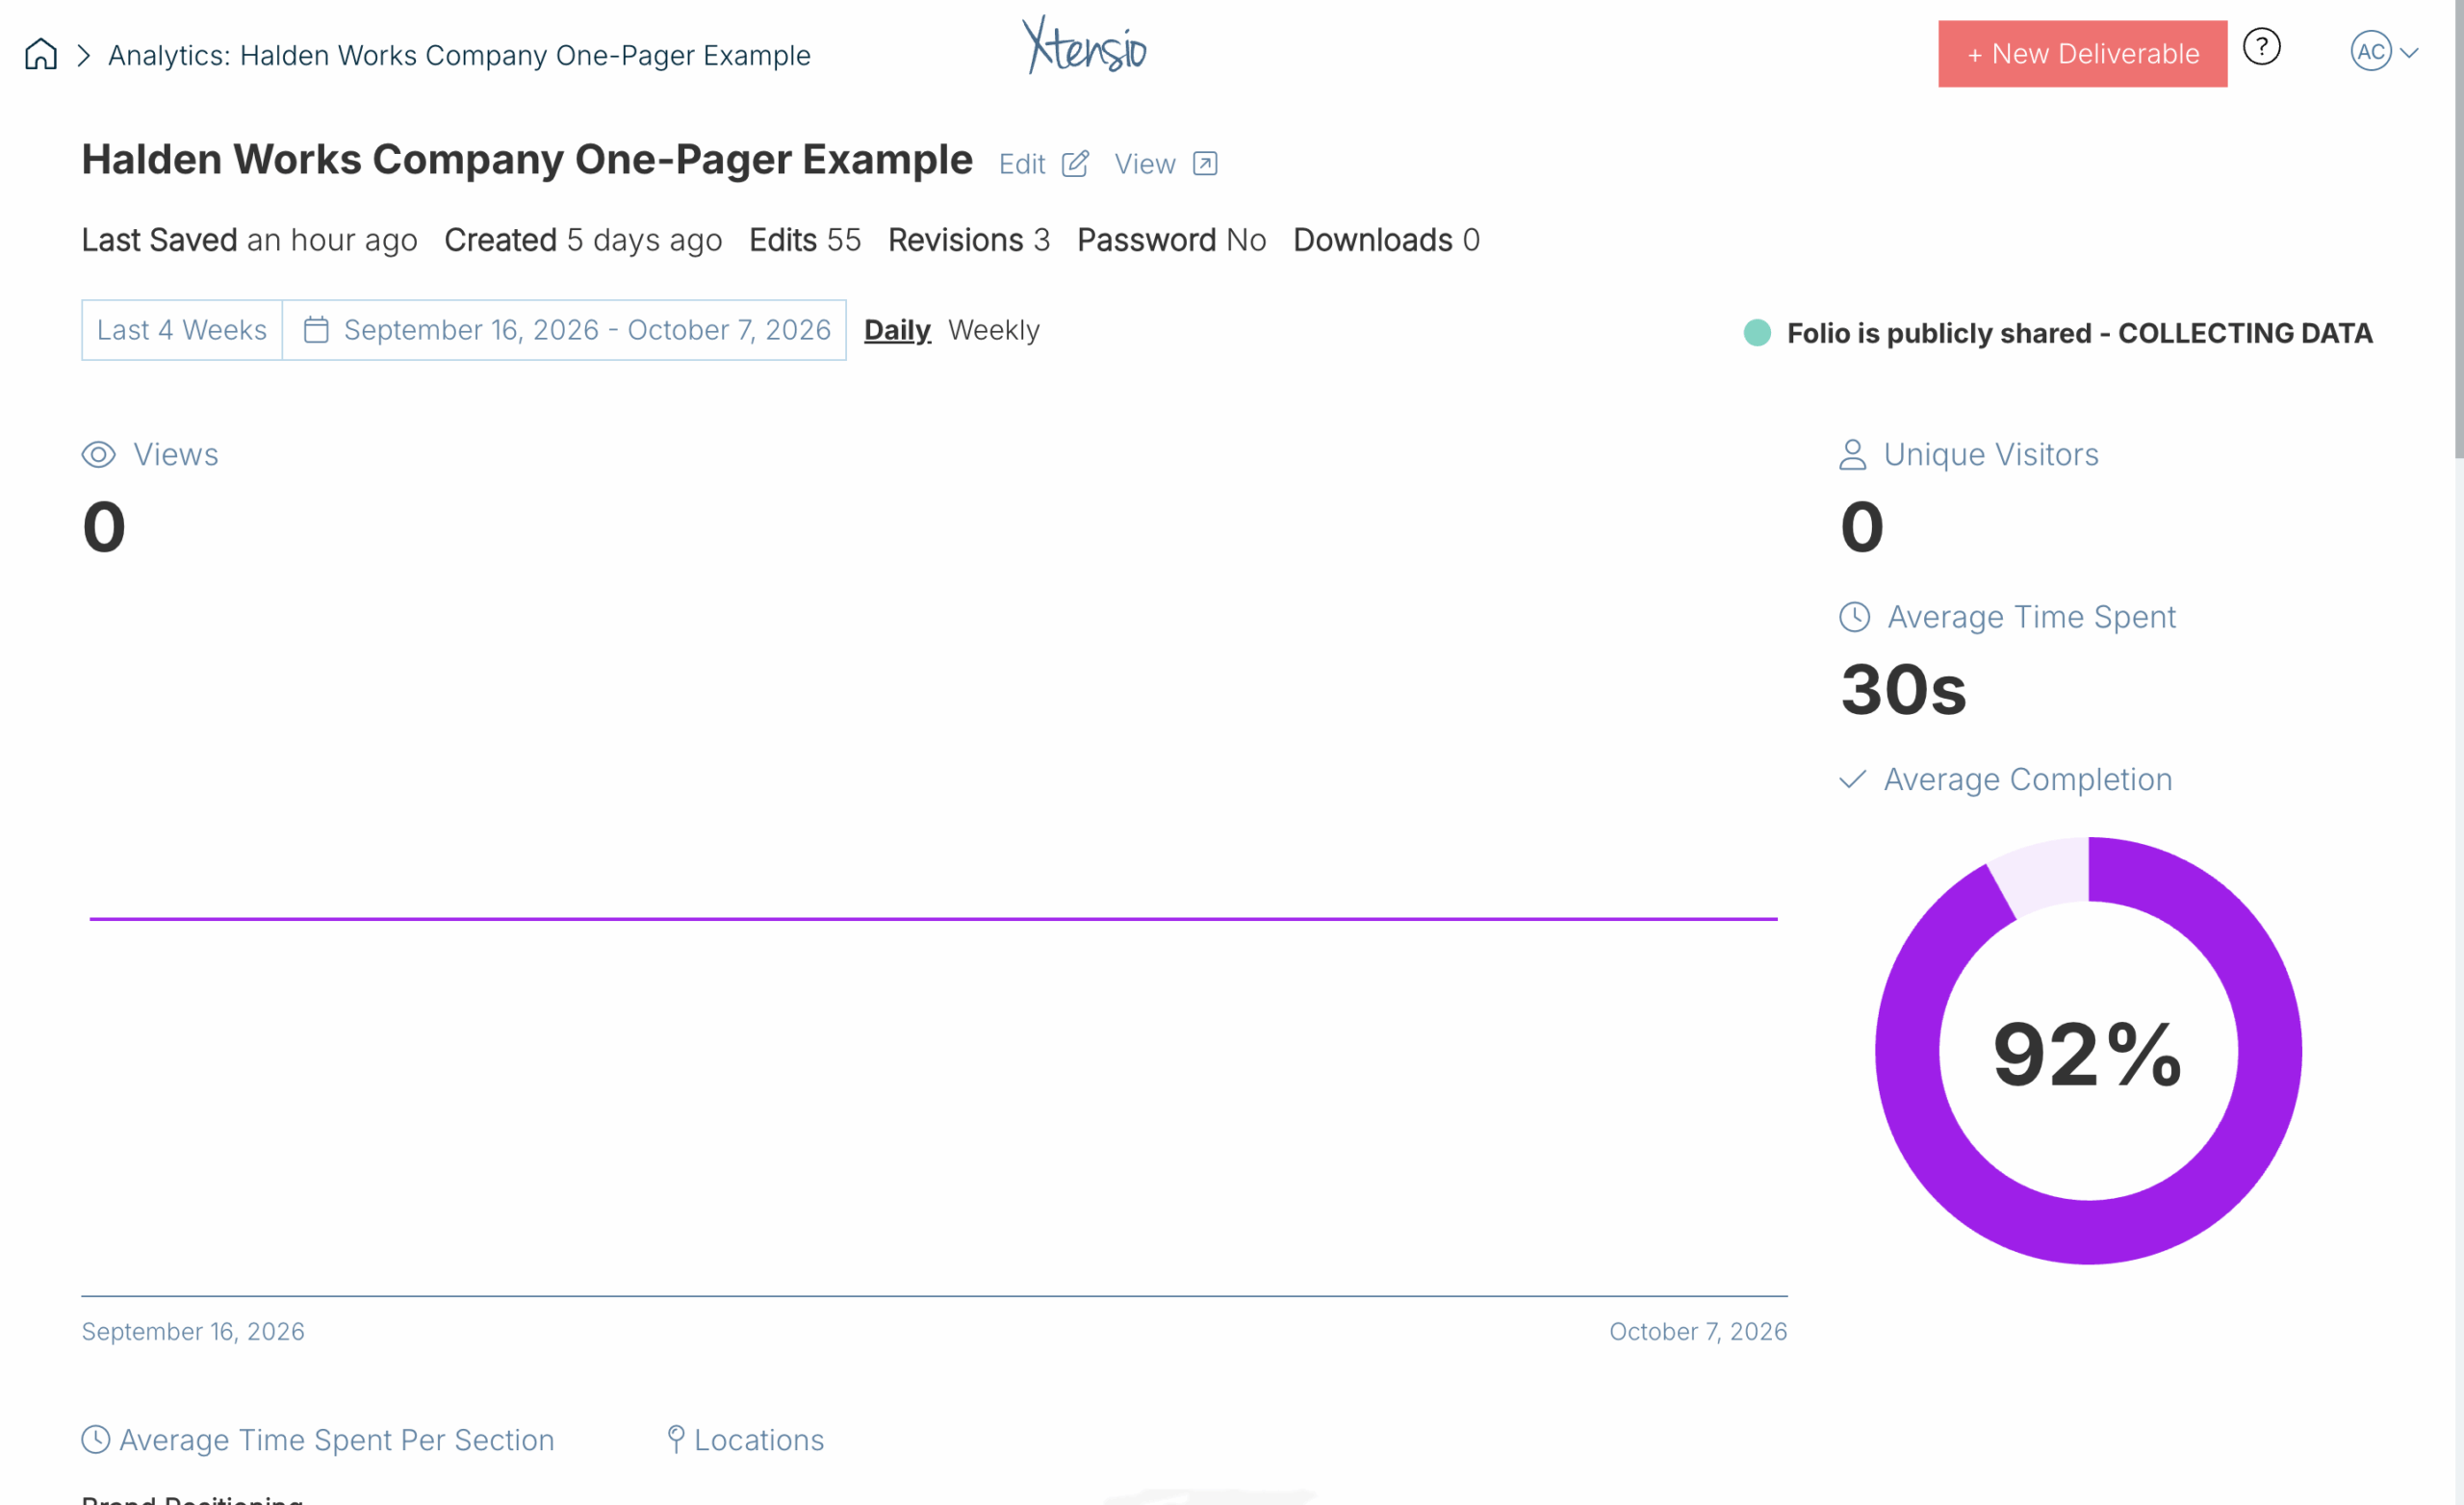
You’ll see Views, Unique Visitors, Average Time Spent and Average Completion, plus time spent per section and visitor locations. Switch between daily and weekly, and change the date range at the top. The page also shows when the deliverable was last saved, how many edits and revisions it has, and how often it was downloaded.
Analytics are collected while the deliverable is shared by link. Engagement analytics are part of Xtensio Plus.
Related: Share a weblink · Export a PDF, PNG or HTML file
Was this article helpful?