Bar graph module
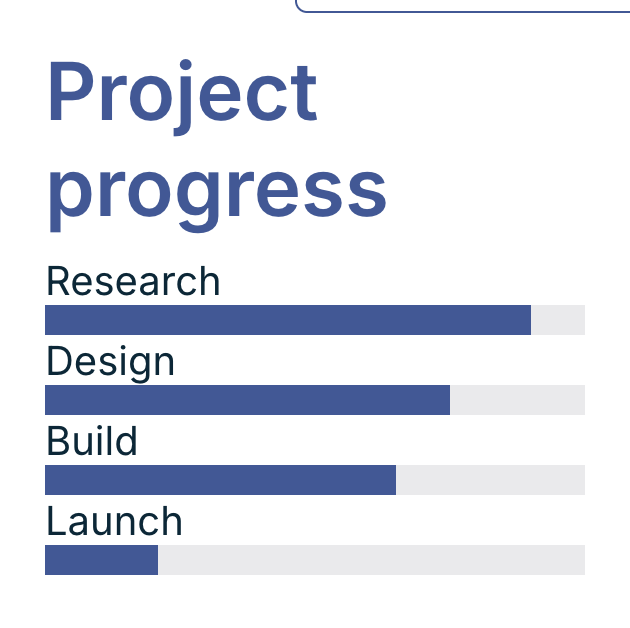
Compare things side by side with horizontal bars, for example progress on project phases, skills, survey results or progress against goals. If you need exact numbers on an axis, use the Bar and line graph module instead.
Add a bar graph
- In the module bar, click the charts icon (the pie chart with a small arrow).
- Choose Add Bar Graph.
It starts with the title Bar Graph and three bars named Bar 1, Bar 2 and Bar 3.
Name a bar
Double-click the name above a bar and type the new name, for example Research.
Set how long a bar is
Drag the end of the bar to the left or right. The length is saved when you let go.
Add or remove bars
- To add a bar, select the graph and click Add (the plus sign) in its toolbar. The new bar is added at the bottom.
- To remove a bar, double-click its name. A small red x appears at the right end of that bar. Click the x.
Change the title
Click the title, click it again to start typing, and replace the text.
Line up the bars inside the module
If you make the graph taller than its bars, use Adjust Vertical Alignment in the toolbar to place the bars at the top (Align to Top), in the middle (Align to Middle) or at the bottom (Align to Bottom).
Change the colour and background
- Graph Color (the paint bucket) colours the bars and the title. Pick one of your Deliverable Colors or Brand Colors, or type a Hex code and click Ok.
- Background opens Update Module Background, where you can pick a colour or an image.
More options
Click More (the three dots) in the graph’s toolbar for Hide Header, Show Border, Duplicate Module, Copy Module and Copy Module Key.
Edit with AI
Select the graph and click Edit with AI. Describe the change, or pick a quick action such as Sort high->low, Round values or Clean up labels. You see a preview first, with Revert and Accept buttons. Each change uses AI credits, and the panel shows how many.
Resize, move and delete
Drag the handles on the sides and bottom corners to resize. Drag the graph to move it. Click Delete Module (the bin) and confirm with Yes, Delete This to remove it. This can’t be undone.
Related: Scale chart module · Working with modules · The editor toolbar